
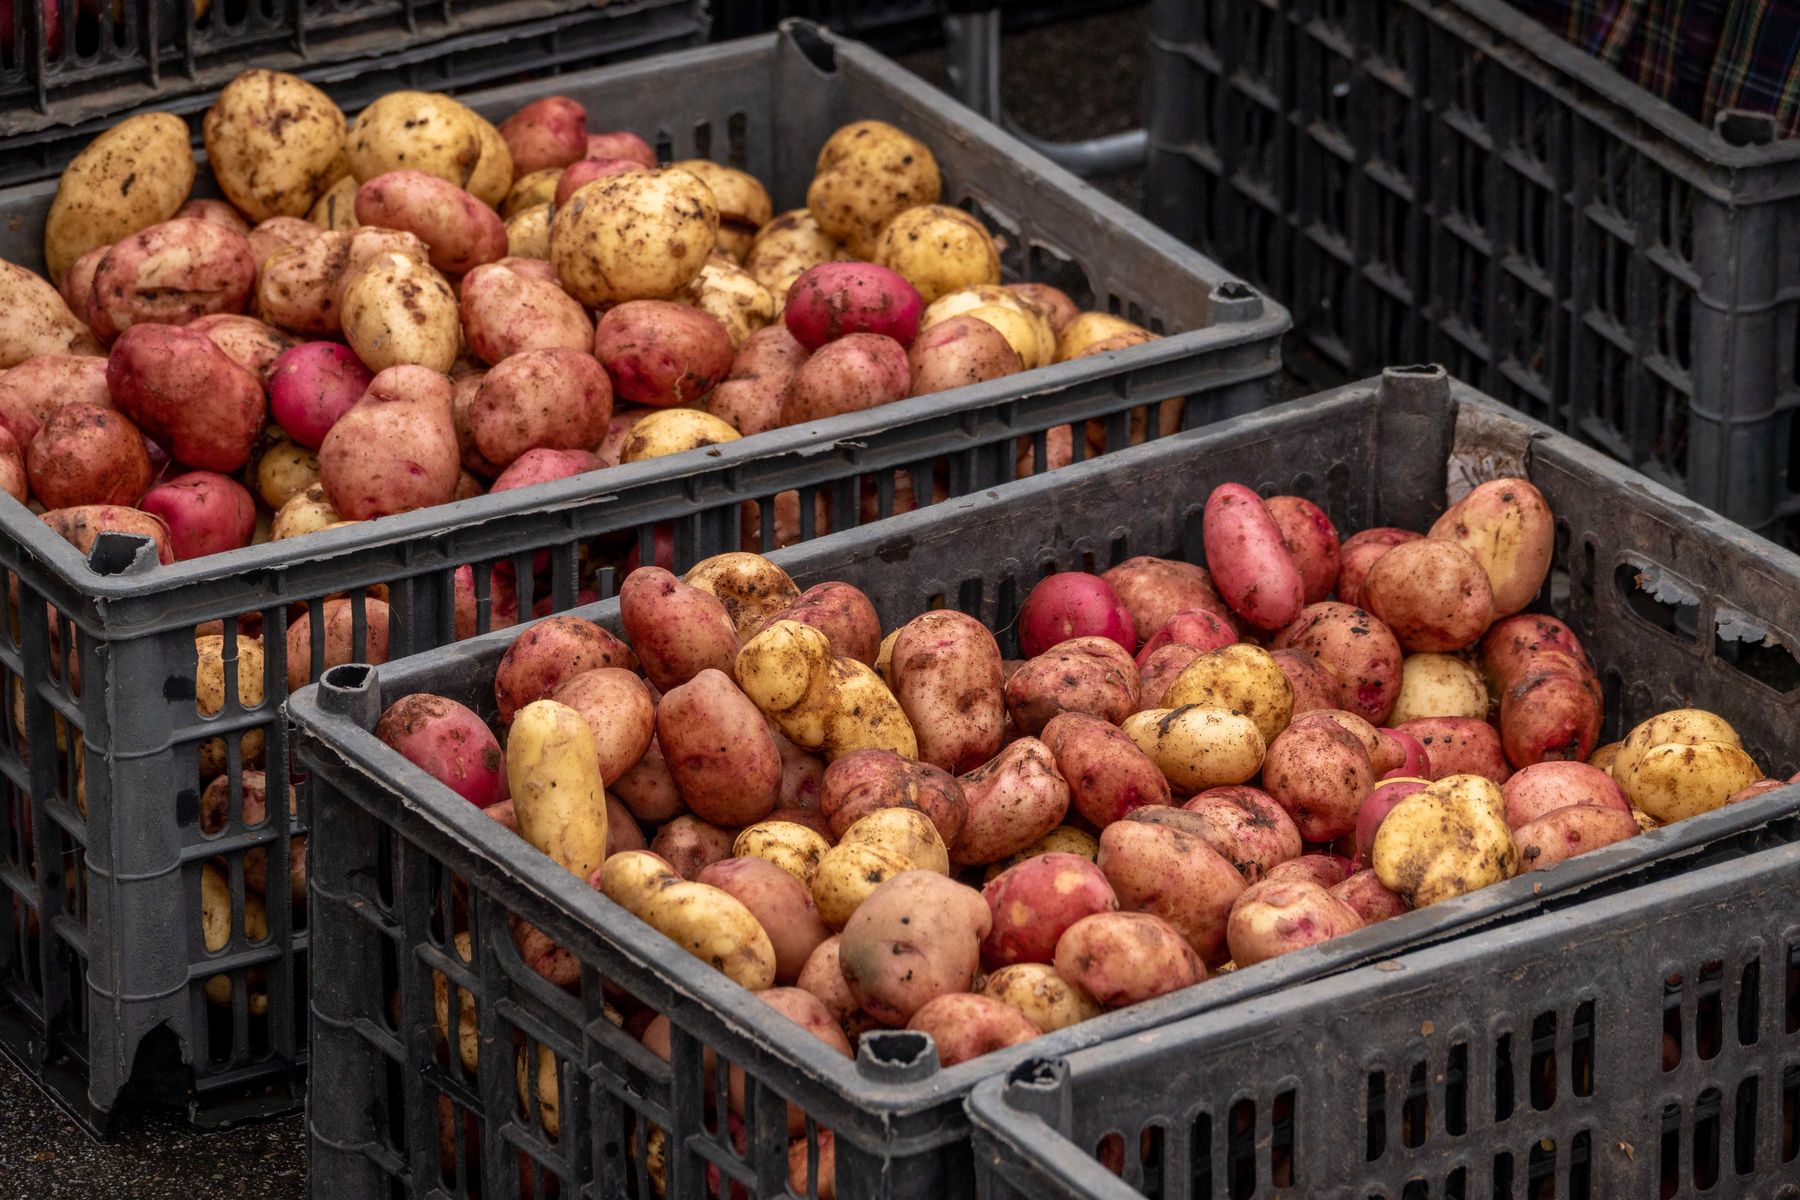
Compare crates and cartons for the same transport task and system boundary. Do not read different life-cycle studies as one verdict.
Set the comparison unit. Use the same functional unit for both options, such as product carried over a stated delivery distance.
Record operating data
Log load per crate, actual completed rotations, loss and breakage, washing and repair, return transport and end-of-life route. Collect carton production, fill and disposal data within the same scope.
Explain the system boundary
The result can change when production, use, cleaning or disposal is excluded. Report the data period, sources and assumptions together.
Fraunhofer’s 2022 report gives 14.5 kg CO2e per tonne for SIM’s reusable-crate model and 47.9 kg for FEFCO’s. Their scopes and assumptions differ. Carton results are 37.7 and 34.7 kg CO2e per tonne respectively; the four figures are not directly comparable.
Also record the return route and replacement assumptions for empty packaging within the same scope.
List which life-cycle stages are included for each option in the report.
What a figure does not say. An industry study does not automatically represent your fill, washing, loss or return pattern.
For your own operation. For the same period, calculate completed transport work and actual consumption data for both packaging options. Note assumptions and report a range.
Track actual rotations, load per crate, damage and loss, washing inputs and empty-packaging returns.

